| UML软件工程组织 | |||
| |
|||
|
|||
2008-08-07 作者:Valentina Popescu 来源:IBM
Profiling an ApplicationIn the current environment of short development cycles for delivering a product, developers tend to focus more on the functional aspects of application execution, mostly via testing, debugging, and code fixing. However, many problems do not easily surface until the application is running in production mode, 24 hours a day, 7 days a week and gets pushed to limits during some unexpected peak periods.The kinds of performance problems encountered in production cannot be discovered during a debugging session. Before deployed and run in production mode, it is important to use a Profiling tool to analyze application execution and identify performance problems, such as execution bottlenecks, object leaks, and system resource limitations. This article provides an introduction to the TPTP Profiling tool. It demonstrates how to use the TPTP Profiling tool to profile a Java application in order to identify performance hot spots, and fix and validate performance problems. TPTP Profiling ToolThe Eclipse Test & Performance Tools Platform (TPTP) Project offers a profiling tool for identifying and isolating performance problems such as performance bottlenecks, object leaks and system resource limits. The tool targets applications of all levels of complexity, from simple standalone Java applications to Eclipse plug-ins or complex enterprise applications running on multiple machines and on different platforms.Being tightly integrated with the Eclipse project, the tool is also easy to use and extend. That means that users can plug in their preferred views to analyze the data, or can extend the data collection metaphor by implementing their own flavor of data collection agent. This article was written using the TPTP 4.2.0 based on the EMF 2.2.0 and XSD 2.2.0 release builds, which require Eclipse 3.2.0. You can download these drivers from here. For TPTP 4.2.0 installation details go to the TPTP download page. Profiling a Java application using TPTP The product catalog sample used in
this article is a simple Java application that parses product information
stored in separate xml files and prints the result to the console
output. The file system location for the folder containing the product
xml files is passed as a program argument when running the main
class, Product.java. The
xml files containing the product information are provided under
the section running
the example.
Starting the application in profiling modeAfter installing the sample application, the first step is to run the product catalog application in profiling mode. Profile the application by using the Profile As > Java Application popup-menu on the Product class as seen in the image below.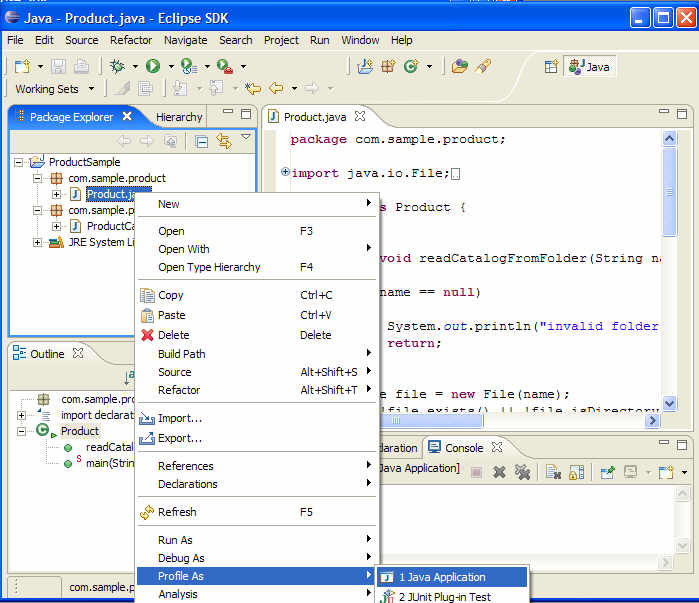
Figure 1 Profile the Product catalog Application Setting the Java program argumentsThe Profile As > Java Application action will open the launch configuration wizard as displayed by Figure 2. For this example, the folder containing
the product xml files is passed as a program argument. As described
in the Figure 2 below, set the program arguments to be
x:\myPath\products, where x:\myPath
is the path where you have unzipped the folder containing
the product xml files provided at the end of this article. 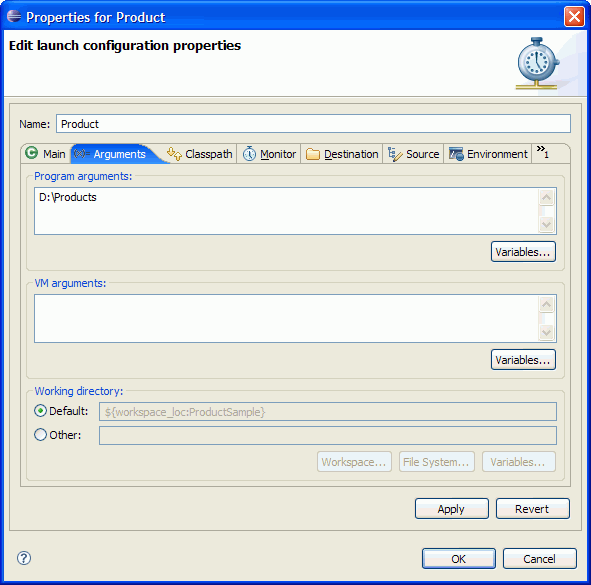 Figure 2 Product catalog sample - program arguments Setting profiling filtersThe next step is to set the profiling options to collect method execution information.To set these options, click the Monitor tab on the Launch Configuration Properties wizard and select a set of profiling options that fits with your performance investigation.  A
Profiling filter set is a reusable set of profiling filters. The purpose
of creating profiling filter sets is to reuse them during consecutive
runs of the same application or to share them between applications
that require the same type of profiling information. A
Profiling filter set is a reusable set of profiling filters. The purpose
of creating profiling filter sets is to reuse them during consecutive
runs of the same application or to share them between applications
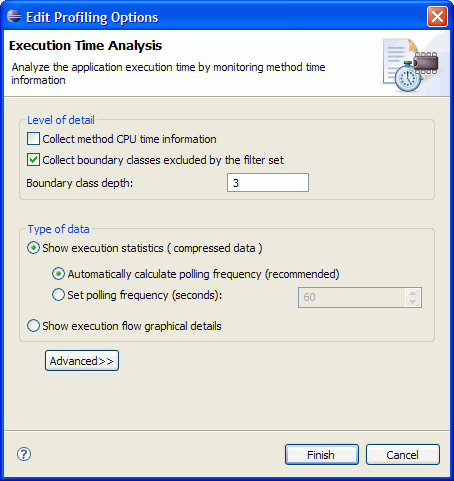
that require the same type of profiling information.The steps below describe how to create a new filter set used to profile the Product catalog application. We will be creating a new filter set named ProductFilterSet which will be used to profile only packages that have the com.sample.product prefix. 1. Choose to collect execution details by selecting the Execution Time Analysis option in the Monitor tab.  Figure 3 Execution Time Analysis option As shown in Figure 3 above we have selected the Execution Time Analysis option that can be used during consecutive runs of the product catalog application. On the next run of this application, the Setting Profiling Filters step can be skipped. 2. Select Edit Options action to set the profiling execution options. 2a. Select the "Collect boundary classes excluded by the filter set" option and enter 3 as the Boundary class depth value. By selecting this option, you specify that you want to collect information for methods invoked to the specified depth starting with the methods in your filter criteria. As an example, let's assume that we have set the filter to collect information on method MyMethod and to filter out methods M1, M2, M3, M4. If the following invocation stack is executed: MyMethod > M1 > M2 > M3 > M4 ( MyMethod invokes M1 which invokes M2 which invokes M3 which invokes M4 ), based on the filtering criteria selected at point 2a, the profiler will show this call stack: MyMethod > M1 > M2 > M3 and will not display the last invocation M3 > M4 (since this exceeds the specified depth of 3). Figure 4 Choose to collect execution information 3. Select the classes to be profiled.
In the Monitor tab, select the Java Profiling item and double click
or select Edit Options action. The Filter Set wizard opens. 3a) Select the Add... action from the filter set list. In the result dialog enter ProductFilterSet as the name of the new filter then click OK 3b) Use the Add... button from the Contents of selected filter set list to create the two filters as shown in Figure 5. 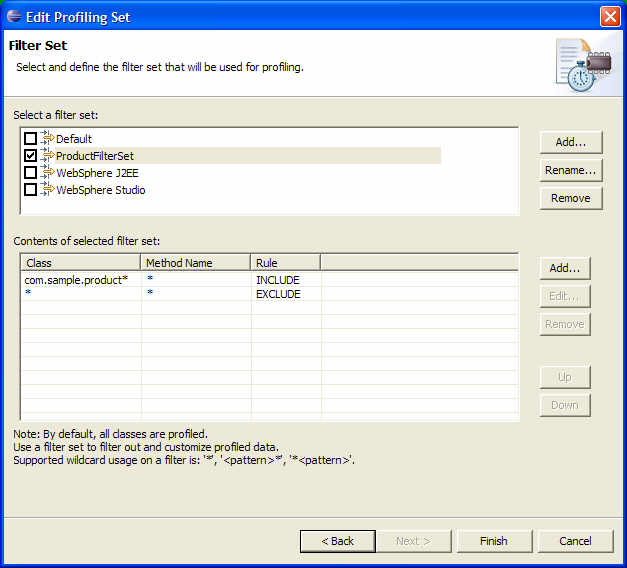 Figure 5 Choose classes you want to profile Run the applicationYou should see the result of the program execution in the Console view, similar with what is presented in Figure 6 below.  Figure 6 Product catalog application has been executed  The TPTP profiling tool allows you to interact with your profiled
application. You can pause and resume monitoring, run garbage
collection on the profiled application, collect object references
or terminate the application.
 Identify performance hot spots using the Execution Statistics viewUse the Execution Statistics view to identify performance hot spots. To open this view, select the process in the Profiling Monitor view and select Open with > Execution Statistics pop-up action.The Execution Statistic view shown in the Figure 7 below display the methods executed, sorted by cumulative time. The cumulative time for a method is the time spent to execute that method, including any invocations to other methods. 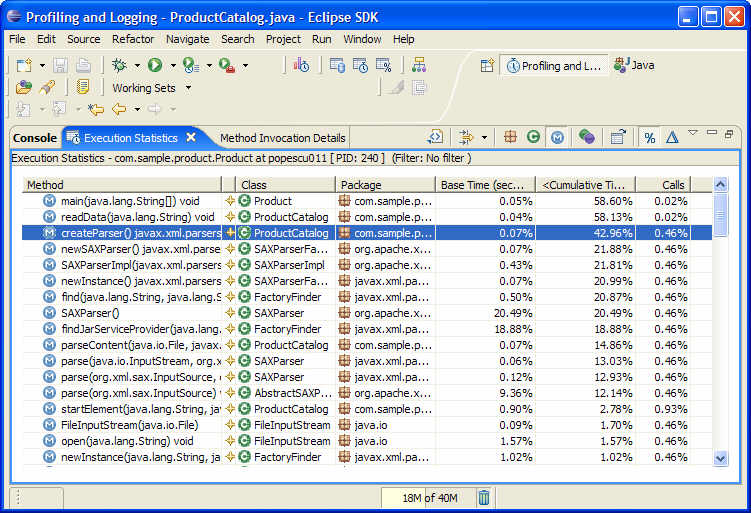
Figure 7 Execution Statistics View As presented in Figure 4, the Execution Statistics shows the main(java.lang.String[]), readData(java.lang.String) and createParser() methods as the top three methods with the highest execution time. It is not surprising to see the main and readData methods on this list since the first one is the starting point of the application execution while the second as suggested by it's name, is reading the products data from the xml files.What comes as a surprise for us is the fact that createParser() method, which just creates a SAX parser instance used to parse the xml files, has such a high execution time. The execution time for this method accounts for 42.96% of the application's total execution time. The Execution Statistics have helped us to identify this method as a potential place to optimize the application's performance. Once we have identified this, let's drill down and see the createParser() method's execution details. Open Method Invocation Details view on the createParser() method We will use next the Method Invocation
Details view to see what methods in the createParser() call stack
are responsible for the method's slow execution time. Open the
Method Invocation Details view by double-click on the createParser()
method in the Execution Statistics view.
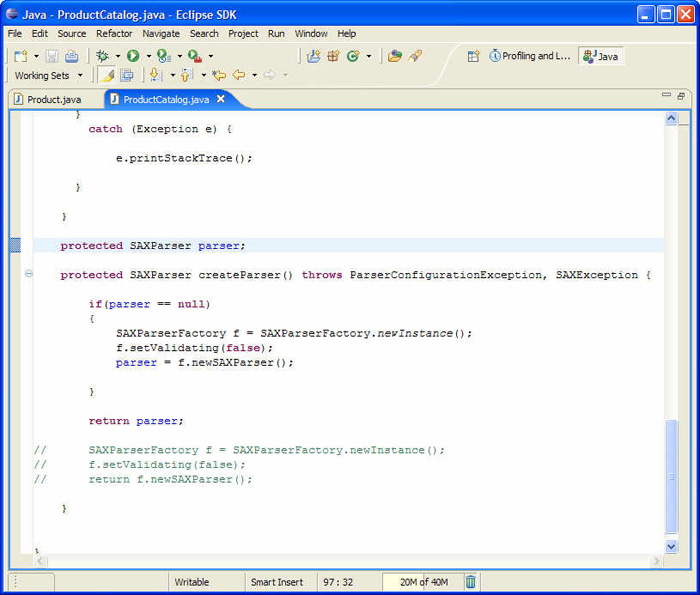
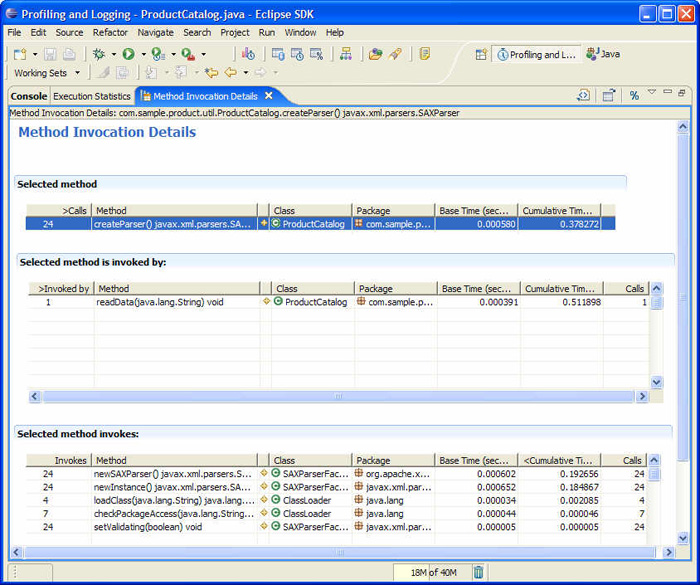 Figure 8 Method Invocation Details view Define a solution for the identified performance problemBy analyzing this data, we found that one way to improve the createParser() execution time is to improve the execution of the two SAXParserFactory methods. Since we have no control over these methods' implementation, the only way to improve our application execution is to reduce the number of calls we make to these methods.The solution is to create one parser instance and reuse it for parsing all xml files, instead of creating a new parser for every file. Let's open the source code and apply the fix. Open the source code and apply the performance fixTo open the source code for the createParser() method, select the method in the Method Invocation Details view then right-click and choose the Open Source action on the pop-up menu. Figure 9 Source code Figure 9 shows the createParser() source
code. Notice that the method creates a new SAX parser instance on
every call. Figure 10 Source code fix As presented in Figure 10, the performance fix defines a global SAXParser instance. The createParser() method initializes the parser and returns this instance every time the method is called. Let's go back now and validate the fix by running the Product catalog application in profiling mode once again. Validate the performance fixTo validate the performance fix, select the Product class in the Java perspective and as described above, right-click and choose Profile As > Java Application. The Profiling options wizard will not
open again as the previous profiling options will be used to run
the application. After the application is executed, open the Execution
Statistics view and compare the execution time. 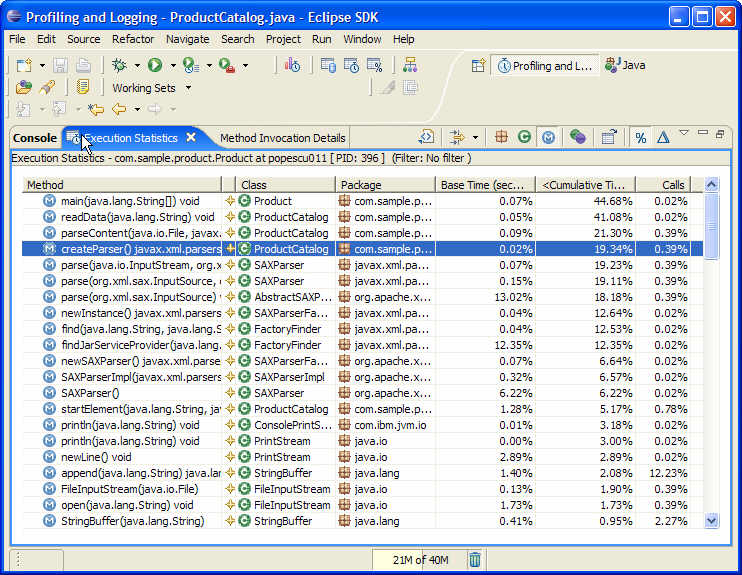 Figure 11 Execution Statistics
view
As you can see in the image above, the createParser() execution time
is now only 19% of the application execution, while before the performance
fix has been applied to the code, the createParser() execution time
was almost 43% of the application execution time.Note that this improvement will prove to be even more valuable as the number of xml files to be parsed increases, so the fix will reduce the application execution time exponential as more product files are being added to the catalog. ConclusionThis article has shown how the TPTP profiling tool can be used to identify and solve performance problems. There are more aspects of the TPTP tool not covered by this article. If you would like to know more about the tool's capabilities, there are a set of tutorial slides and User Guides available here.Running the exampleThe file "ProductCatalog_example.zip" contains the complete source code for the example in this article. Extract the content of the ZIP file into the Eclipse "plugins" directory. You will also need the list of product xml files which are stored in the products.zip file. Extract the content of the products.zip file to a desired location on your file system and use this path as a program argument when running the Product catalog application. |
组织简介 | 联系我们 | Copyright 2002 ® UML软件工程组织 京ICP备10020922号 京公海网安备110108001071号 |
