| БрМЭЦМі: |
БОЮФНВНтLogisticЛиЙщЕФTensorboardПЩЪгЛЏЃЌЕМШыЪ§ОнМЏЃЌВЮЪ§ЩшжУЃЌЙЙНЈФЃаЭКЭВйзїЃЈФЃаЭ+Ы№ЪЇКЏЪ§+гХЛЏ+зМШЗТЪЃЉЁЃЯЃЭћЖдФњгаЫљАяжњЁЃ
БОЮФРДздгкМђЪщЃЌгЩЛ№СњЙћШэМўDeloresБрМЁЂЭЦМіЁЃ |
|
TensorBoardМђНщ
TensorBoardЪЧTensorflowздДјЕФвЛИіЧПДѓЕФПЩЪгЛЏЙЄОпЃЌвВЪЧвЛИіwebгІгУГЬађЬзМўЁЃдкжкЖрЛњЦїбЇЯАПтжаЃЌTensorflowЪЧФПЧАЮЈвЛздДјПЩЪгЛЏЙЄОпЕФПтЃЌетвВЪЧTensorflowЕФвЛИігХЕуЁЃбЇЛсЪЙгУTensorBoardЃЌНЋПЩвдАяжњЮвУЧЙЙНЈИДдгФЃаЭЁЃ
етРяашвЊРэНтЁАПЩЪгЛЏЁБЕФвтвхЁЃЁАПЩЪгЛЏЁБвВНазіЪ§ОнПЩЪгЛЏЁЃЪЧЙигкЪ§ОнжЎЪгОѕБэЯжаЮЪНЕФбаОПЁЃетжжЪ§ОнЕФЪгОѕБэЯжаЮЪНБЛЖЈвхЮЊвЛжжвдФГжжИХвЊаЮЪНГщЬсГіРДЕФаХЯЂЃЌАќРЈЯргІаХЯЂЕЅЮЛЕФИїжжЪєадКЭБфСПЁЃР§ШчЮвУЧашвЊПЩЪгЛЏЫуЗЈдЫааЕФДэЮѓТЪЃЌФЧУДЮвУЧПЩвдШЁЫуЗЈУПДЮбЕСЗЕФДэЮѓТЪЃЌЛцжЦГЩелЯпЭМЛђЧњЯпЭМЃЌРДБэДябЕСЗЙ§ГЬжаДэЮѓТЪЕФБфЛЏЁЃПЩЪгЛЏЕФЗНЗЈгаКмЖржжЁЃЕЋЮоТлФФвЛжжЃЌОљЪЧЖдЪ§ОнНјааеЊвЊ(summary)гыДІРэЁЃ
ЭЈГЃЪЙгУTensorBoardгаШ§ИіВНжшЃК
ЪзЯШашвЊдкашвЊПЩЪгЛЏЕФЯрЙиВПЮЛЬэМгПЩЪгЛЏДњТыЃЌМДДДНЈеЊвЊЁЂЬэМгеЊвЊЃЛ
ЦфДЮдЫааДњТыЃЌПЩвдЩњГЩСЫвЛИіЛђЖрИіЪТМўЮФМў(event files)ЃЛ
зюКѓЦєЖЏTensorBoardЕФWebЗўЮёЦїЁЃ
ЭъГЩвдЩЯШ§ИіВНжшЃЌОЭПЩвддкфЏРРЦїжаПЩЪгЛЏНсЙћЃЌWebЗўЮёЦїНЋЛсЗжЮіетИіЪТМўЮФМўжаЕФФкШнЃЌВЂдкфЏРРЦїжаНЋНсЙћЛцжЦГіРДЁЃ
ШчЙћЮвУЧвбОгЕгаСЫвЛИіЪТМўЮФМўЃЌвВПЩвджБНгРћгУTensorBoardВщПДетИіЪТМўЮФМўжаЕФеЊвЊЁЃ
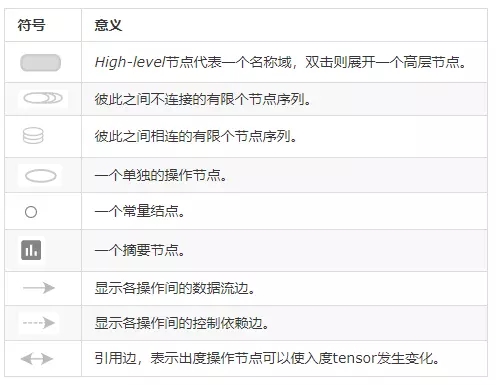
TensorBoardЪгЭМШчЯТЫљЪОЃК

TensorBoardЪОвтЭМ
LogisticЛиЙщЕФTensorboardПЩЪгЛЏ
from __future__
import print_function
import tensorflow as tf |
ЕМШыЪ§ОнМЏ
# Import MINST
data
from tensorflow.examples.tutorials.mnist
import
input_data
mnist = input_data.read_data_sets
("./data/",
one_hot=True) |
Extracting ./data/train-images-idx3-ubyte.gz
Extracting ./data/train-labels-idx1-ubyte.gz
Extracting ./data/t10k-images-idx3-ubyte.gz
Extracting ./data/t10k-labels-idx1-ubyte.gz |
ВЮЪ§ЩшжУ
# Parameters
learning_rate = 0.01
training_epochs = 25
batch_size = 100
display_epoch = 1
logs_path = './log/example/' # logДцЗХЮЛжУ
# tf Graph Input
# mnist data image of shape 28*28=784
#ЃЈname=''НЋдкTensorboardжаЯдЪОЃЉ
x = tf.placeholder(tf.float32,
[None, 784],
name='InputData')
#ЪфШыЪ§ОнЃЈInputDataЃЉ
# 0-9 digits recognition => 10 classes
y = tf.placeholder(tf.float32,
[None, 10], name='LabelData')
# ЪфГіБъЧЉЃЈLabelDataЃЉ
# Set model weights
W = tf.Variable(tf.zeros([784, 10]),
name='Weights')
#ШЈжиЃЈWeightsЃЉ
b = tf.Variable(tf.zeros([10]),
name='Bias')
#ЦЋжУЃЈBiasЃЉ |
ЙЙНЈФЃаЭКЭВйзїЃЈФЃаЭ+Ы№ЪЇКЏЪ§+гХЛЏ+зМШЗТЪЃЉ
# Construct model
and encapsulating
all ops into scopes, making
# Tensorboard's Graph visualization
more convenient
with tf.name_scope('Model'):
# Model
pred = tf.nn.softmax(tf.matmul(x, W) + b)
# Softmax
with tf.name_scope('Loss'):
# Minimize error using cross entropy
cost = tf.reduce_mean(-tf.reduce_sum
(y * tf.log(pred),
reduction_indices=1))
with tf.name_scope('SGD'):
# Gradient Descent
optimizer = tf.train.GradientDescentOptimizer
(learning_rate).minimize(cost)
with tf.name_scope('Accuracy'):
# Accuracy
acc = tf.equal(tf.argmax(pred, 1),
tf.argmax(y,
1))
acc = tf.reduce_mean(tf.cast(acc, tf.float32))
# Initializing the variables
init = tf.global_variables_initializer()
# Create a summary to monitor cost tensor
tf.summary.scalar("loss", cost)
# Create a summary to monitor accuracy tensor
tf.summary.scalar("accuracy", acc)
# Merge all summaries into a single op
merged_summary_op = tf.summary.merge_all() |
бЕСЗВЂБЃДцlog
# Start Training
with tf.Session() as sess:
sess.run(init)
# op to write logs to Tensorboard
summary_writer = tf.summary.
FileWriter(logs_path,
graph=tf.get_default_graph())
# Training cycle
for epoch in range(training_epochs):
avg_cost = 0.
total_batch = int
(mnist.train.num_examples /
batch_size)
# Loop over all batches
for i in range(total_batch):
batch_xs, batch_ys = mnist.train.next_batch
(batch_size)
# Run optimization op (backprop), cost op
(to
get loss value)
# and summary nodes
_, c, summary = sess.run
([optimizer, cost, merged_summary_op],
feed_dict={x: batch_xs, y: batch_ys})
# Write logs at every iteration
summary_writer.add_summary
(summary, epoch *
total_batch + i)
# Compute average loss
avg_cost += c / total_batch
# Display logs per epoch step
if (epoch+1) % display_epoch == 0:
print("Epoch:", '%04d' % (epoch+1),
"cost=", "{:.9f}".format(avg_cost))
print("Optimization Finished!")
# Test model
# Calculate accuracy
print("Accuracy:", acc.eval
({x: mnist.test.images,
y: mnist.test.labels}))
print("Run the command line:\n"
\
"--> tensorboard --logdir=./log"
\
"\nThen open http://0.0.0.0:6006/
into
your web browser") |
Epoch: 0001 cost=
1.183717763
Epoch: 0002 cost= 0.665147323
Epoch: 0003 cost= 0.552818966
Epoch: 0004 cost= 0.498699070
Epoch: 0005 cost= 0.465521080
Epoch: 0006 cost= 0.442596199
Epoch: 0007 cost= 0.425560050
Epoch: 0008 cost= 0.412205354
Epoch: 0009 cost= 0.401337254
Epoch: 0010 cost= 0.392412475
Epoch: 0011 cost= 0.384738669
Epoch: 0012 cost= 0.378180920
Epoch: 0013 cost= 0.372407395
Epoch: 0014 cost= 0.367316018
Epoch: 0015 cost= 0.362715464
Epoch: 0016 cost= 0.358595766
Epoch: 0017 cost= 0.354887394
Epoch: 0018 cost= 0.351458600
Epoch: 0019 cost= 0.348339875
Epoch: 0020 cost= 0.345448156
Epoch: 0021 cost= 0.342770365
Epoch: 0022 cost= 0.340232303
Epoch: 0023 cost= 0.337901928
Epoch: 0024 cost= 0.335753958
Epoch: 0025 cost= 0.333657109
Optimization Finished!
Accuracy: 0.9136
Run the command line:
--> tensorboard --logdir=./log
Then open http://0.0.0.0:6006/
into your web browser |
Ы№ЪЇКЭзМШЗТЪЕФПЩЪгЛЏ
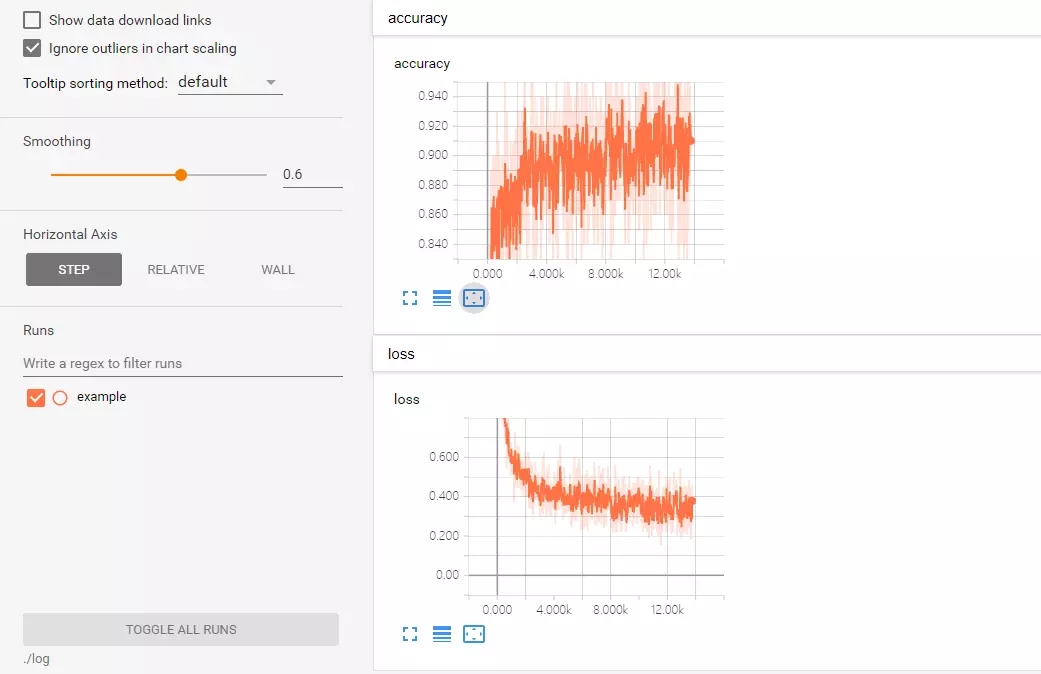
Loss and Accuracy Visualization
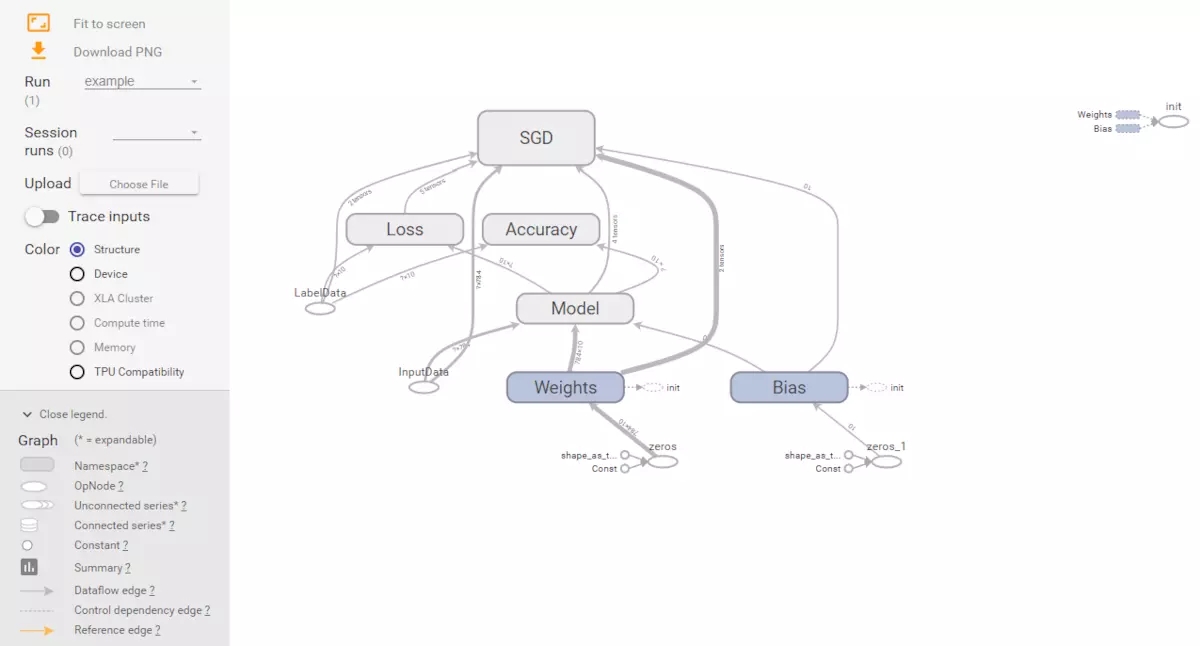
МЦЫуЭМФЃаЭЕФЛљБОЕЅдЊ
МЦЫуЭМФЃаЭЕФПЩЪгЛЏ
|